This is the third post in a series about Reducing Gun Violence in the United States. The previous post described Gun Markets, Ownership, and Violence Risk.
In this post, I’ll introduce the relationship between firearms and suicide.
- For those who want to see the highlights without going through the data, skip right to the conclusions at the bottom of this post.
- The data in this post comes from several different sources, which I’ve linked in the references section at the bottom of this post for those who want to see the data for themselves or dive deeper.
Background on Suicide
In 2017, there were around 24,000 firearm suicides in the United States; this accounts for half of all suicides during that year (over 47,000).
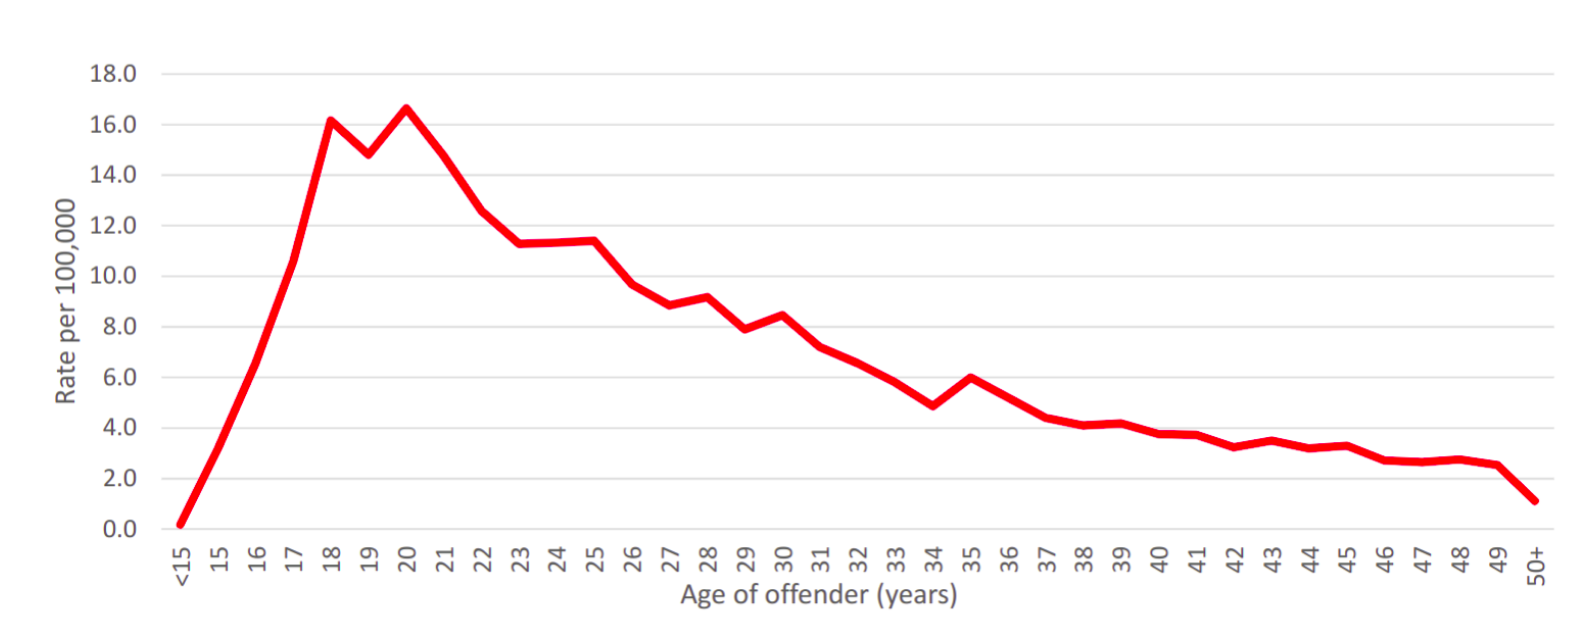
Suicide was the tenth leading cause of death overall, and the second leading cause of death for people under the age of 35 (source: CDC WISQARS).
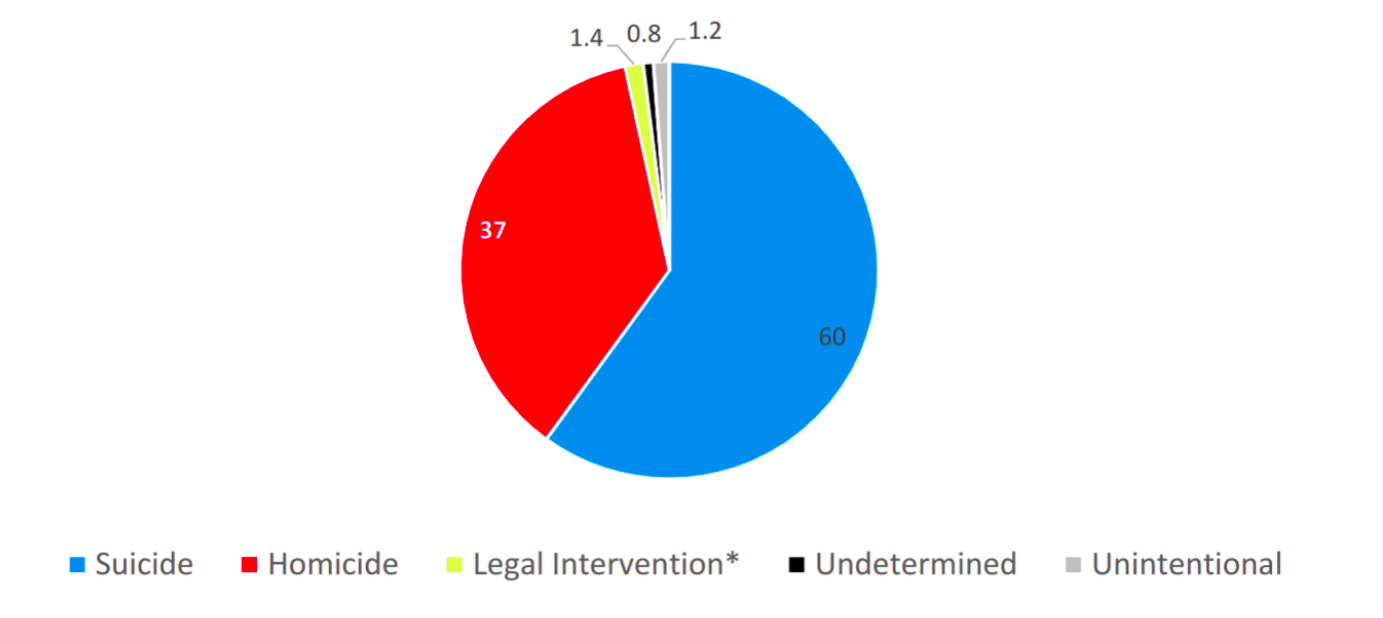
The number of firearm deaths due to various causes looked like this (source CDC Wonder):
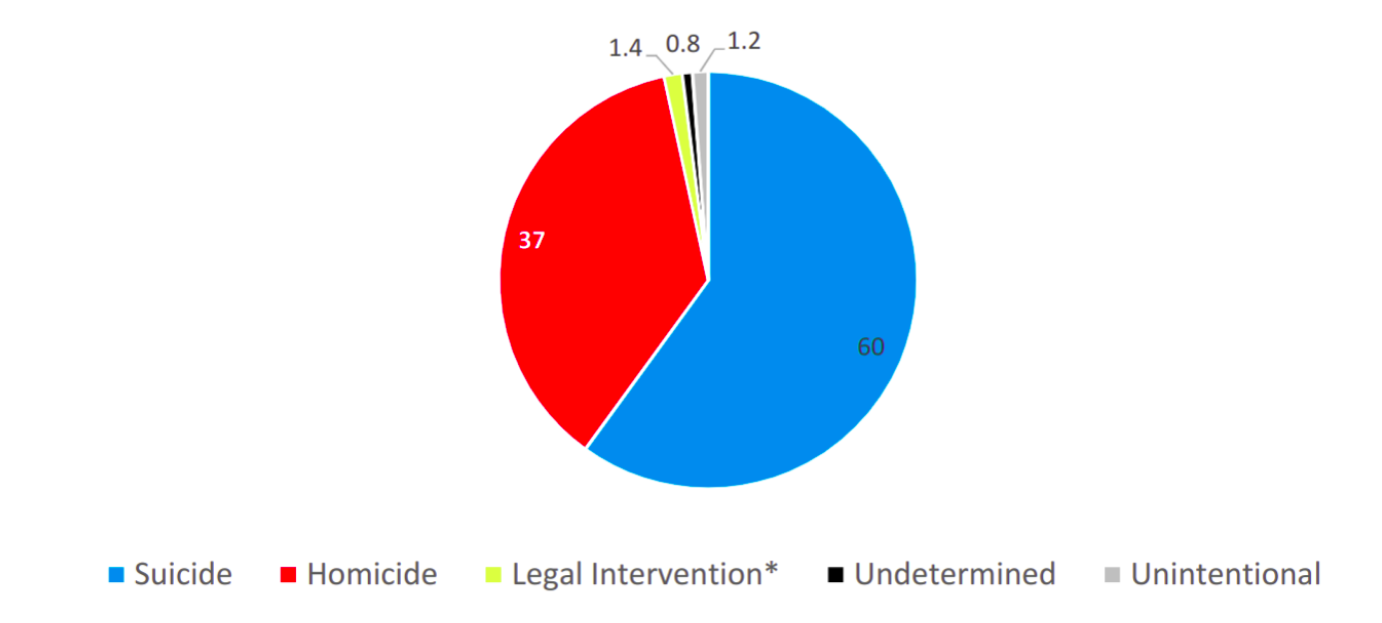
- Suicide: 60% (23,854)
- Homicide: 37% (14,542)
- Legal Intervention (typically due to law enforcement activities): 1.4% (538)
- Unintentional: 1.2% (495)
- Unknown: 0.8% (338)
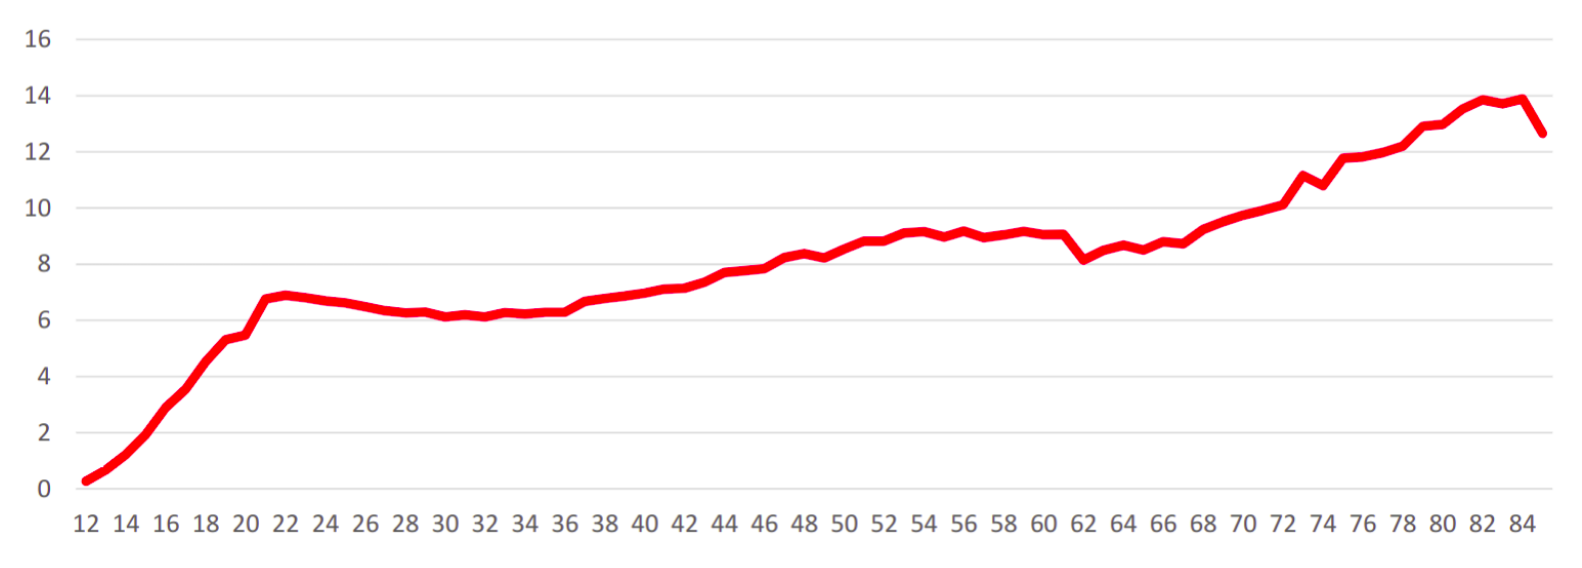
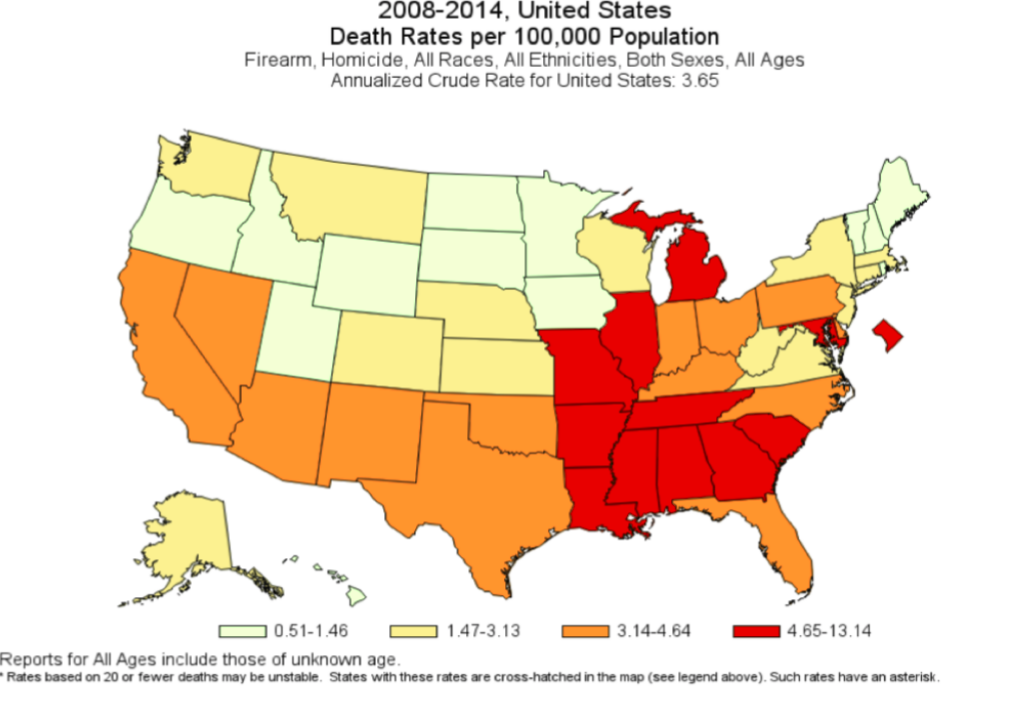
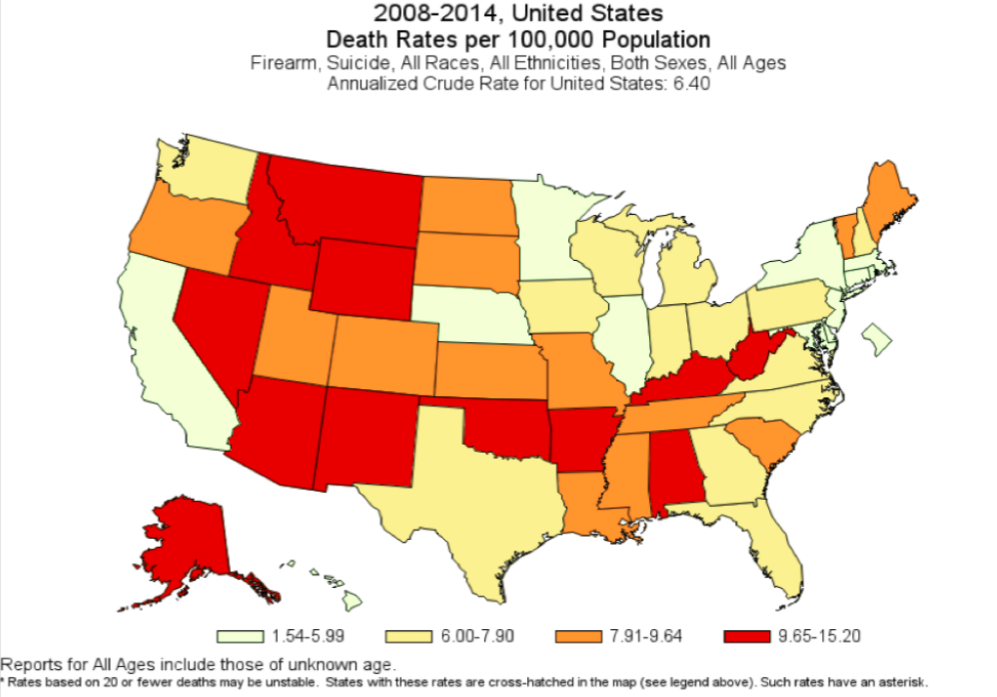
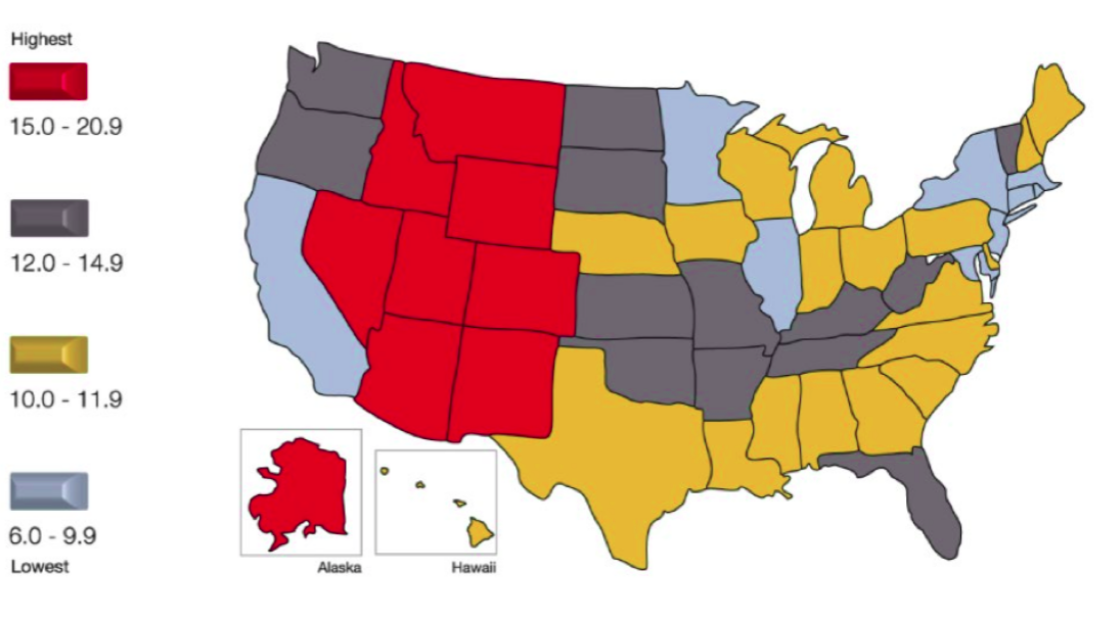
Suicide rates vary dramatically across the various states, with some states having as many as four times the number of suicides as other states:
Suicide Rates in the United States (source CDC WISQARS)
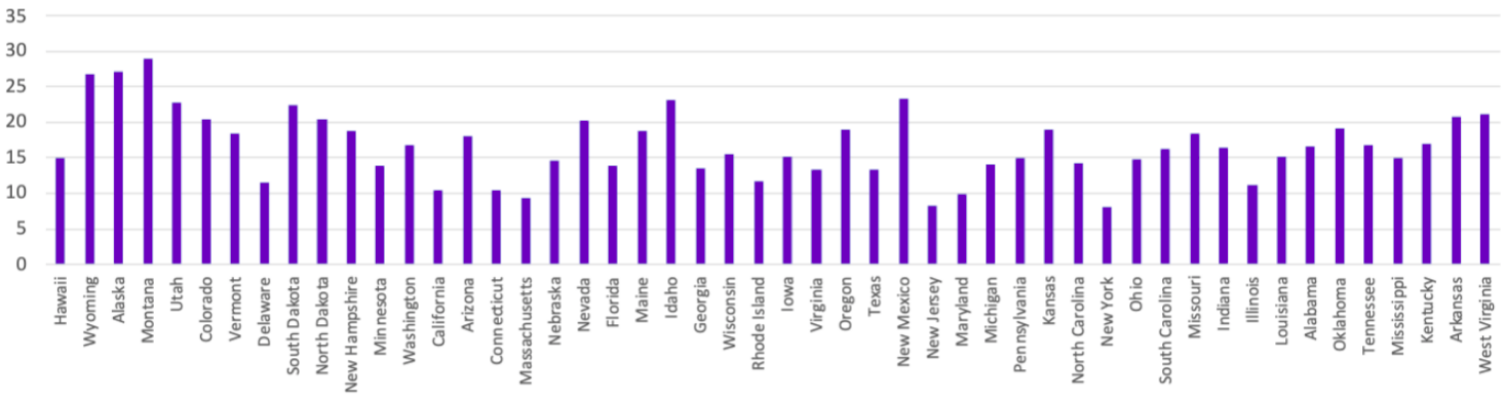
The following graph sorts the states left to right; states with highest levels of self-reported emotional and psychological well-being on the left, and those with lowest levels on the right. States with the highest suicide rates are not those states which have the lowest levels of emotional and psychological well-being. On its face, this is a puzzling result.
Suicide rates (age-adjusted) related to rates of well-being (source Gallup Well-Being)
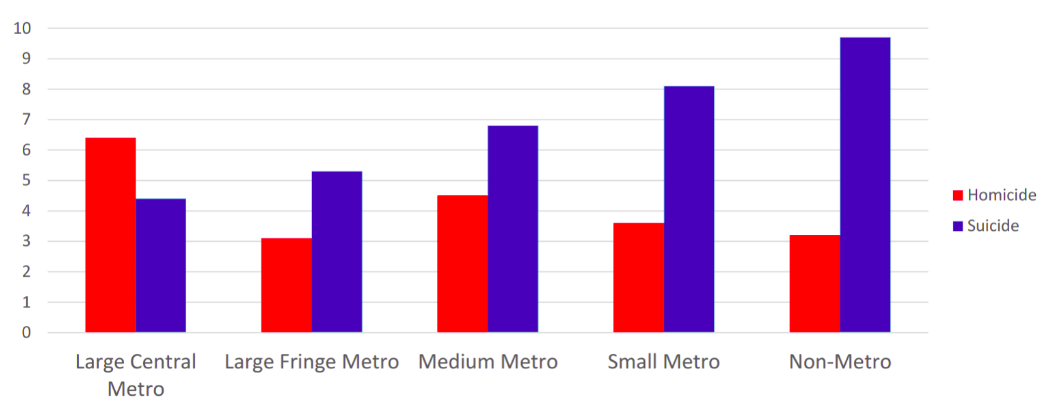
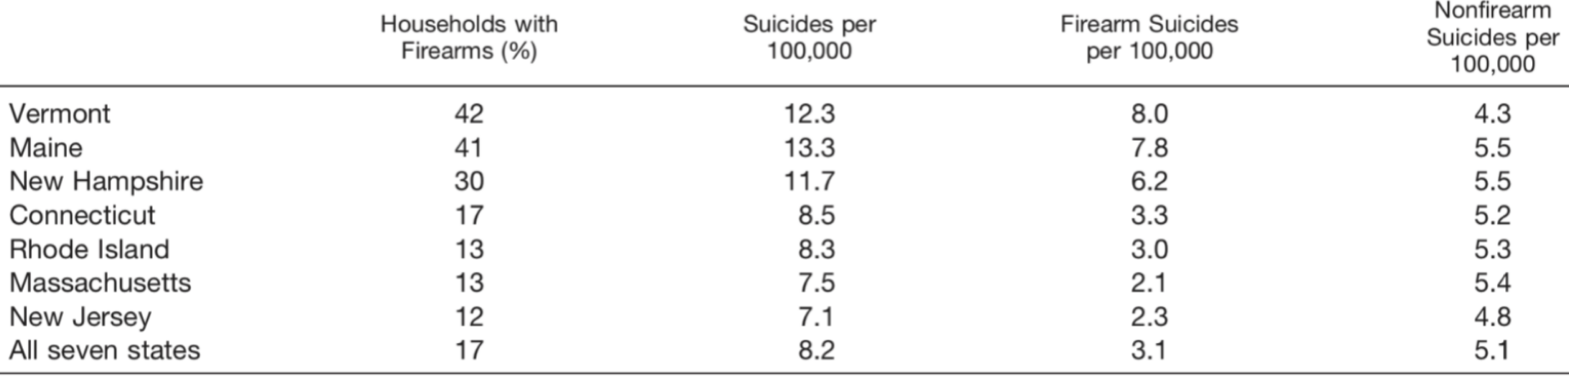
Let’s continue looking at the rates of firearm ownership and suicide, firearm suicide, and non-firearm suicide across several states. What we see is that
- the more firearms are owned in the state, the higher the rate of firearm suicide
- the more firearms are owned in the state is not related to the number of non-firearm suicides
- rates of suicide overall are much higher in states with more gun ownership
Rates of firearm ownership and suicide (source: Firearms in the Northeast)
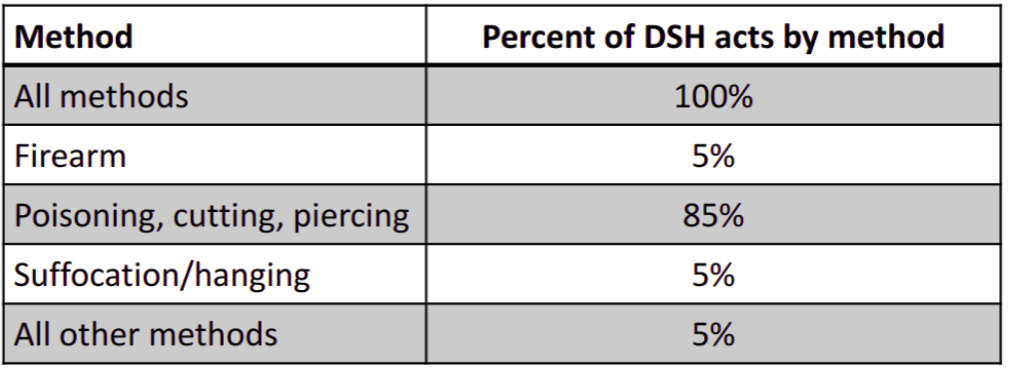
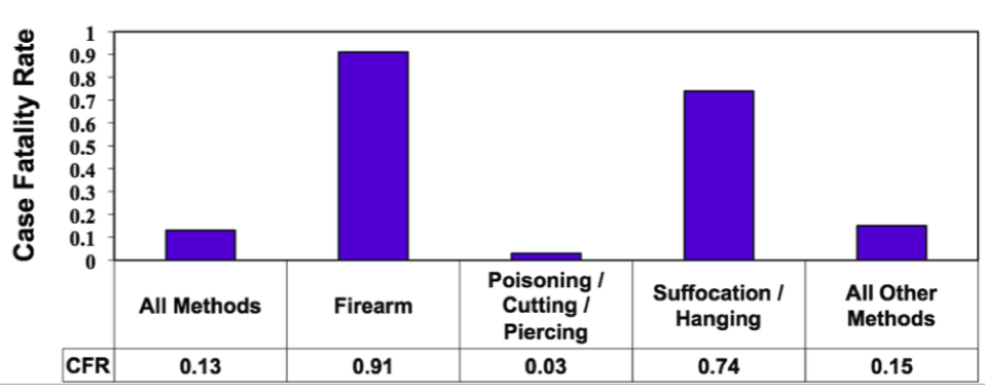
Let’s take a look at acts where people try to harm themselves:
- Most people attempting to harm themselves do so by poisoning, cutting, or piercing (85%)
- Poisoning, cutting, and piercing only result in fatal injuries 3% of the time
- Very few people attempting to harm themselves do so using firearms (5%)
- Use of a firearm in self-harm results in a fatal injury 91% of the time
In short, when people use a firearm to hurt themselves, they are very, very likely to end up with a fatality.
Deliberate Self-Harm and Case Fatality Rate by Act, Seven Northeastern states, 1994-2000 (source CDC WISQARS and HCUP-NIS)
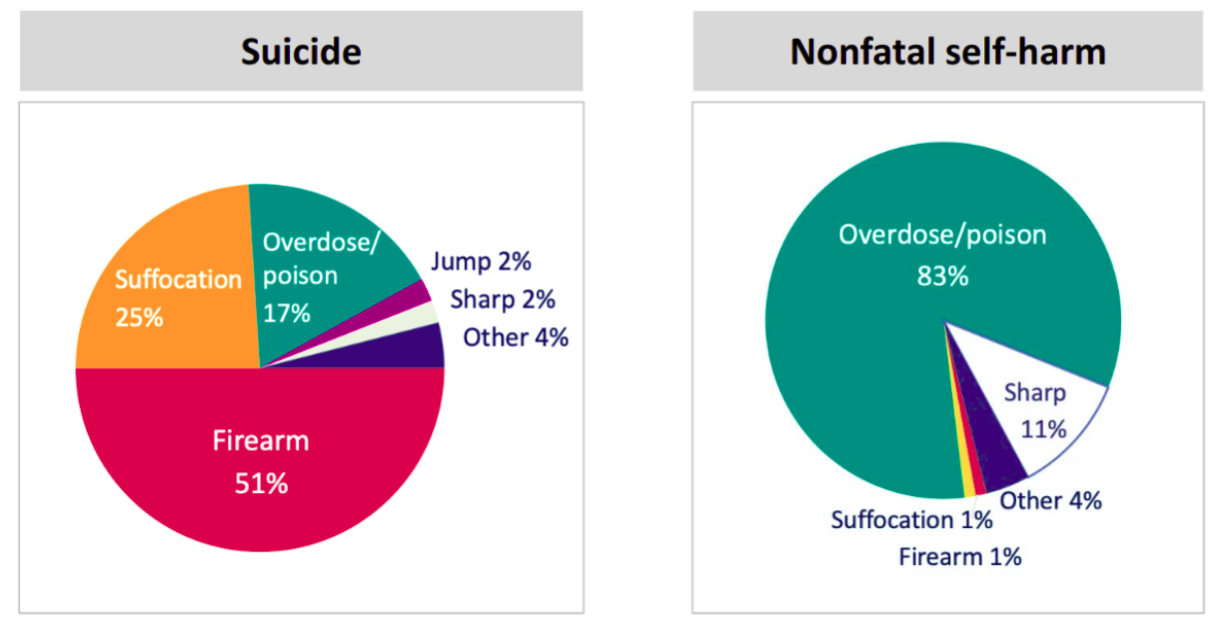
Looking at the data another way:
- Those people whose suicide attempt was successful had used a firearm in more than half of cases
- Those people whose suicide attempt was unsuccessful had used poison or an overdose 83% of the time
A key insight is that if access to firearms is difficult for people in a crisis where they are considering suicide, they are more likely to use a different method, which is much more likely to result in a life being saved.
Methods of Self-Harm (source CDC WISQARS and HCUP-HIS)
When reviewing cases of survivors of suicide attempts, we find some interesting other information:
- suicidal acts are typically impulsive, and the thoughts that lead to those acts are typically temporary
- the choice of suicide method is largely dependent on the availability of that method (such as a gun)
- less than 10% of suicide survivors re-attempt suicide a second time
- so if we can lessen the risk of a successful first suicide attempt, those people are much, much more likely to survive long-term
Saving a person who has suicidal thoughts today means very likely saving their life in the long run.
Data-driven Studies
How do we know that firearms availability actually is a cause of increased suicide risk, rather than just being correlated with it?
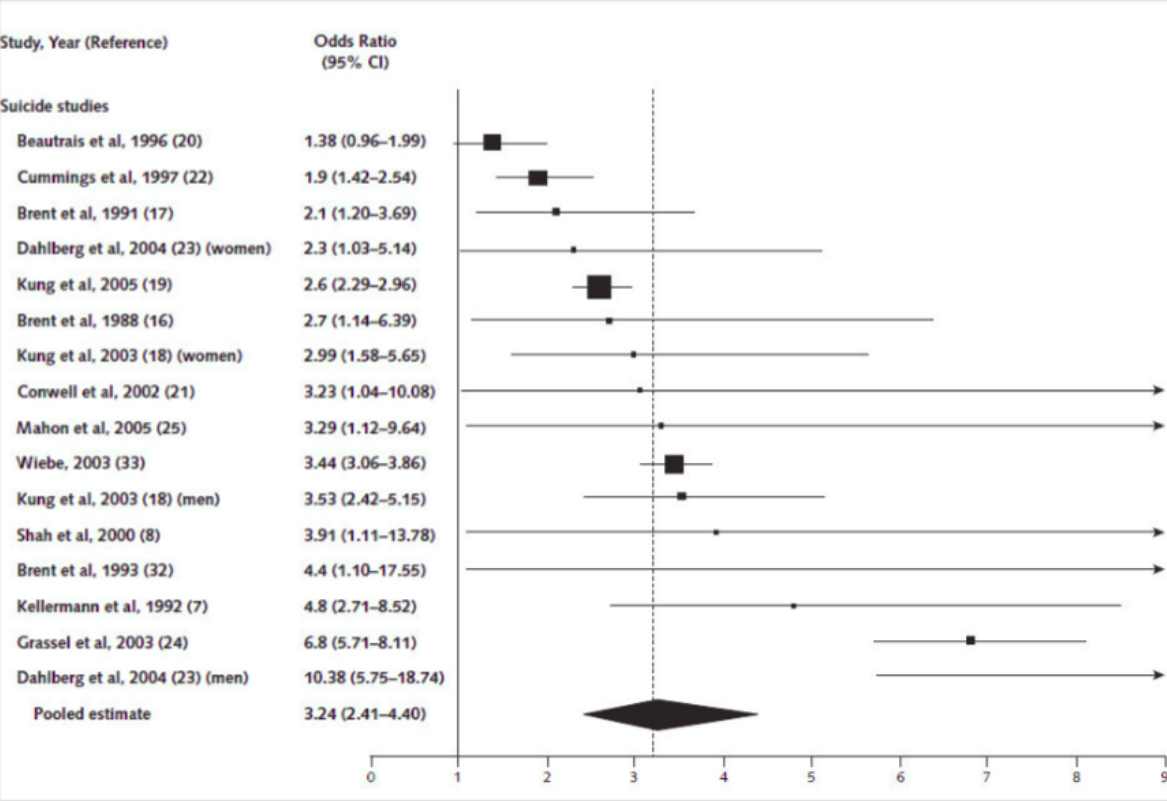
More than a dozen studies between 1991 and 2005 show that having a firearm in a home greatly increases the risk of suicide for all members of the household, especially young adults and children. These studies controlled for age, alcohol usage, community, depression, education, illegal drug use, medication usage, and mental health diagnosis.
Accessibility of Firearms and Risk of Suicide Among Household Members (source: Accessibility of Firearms)
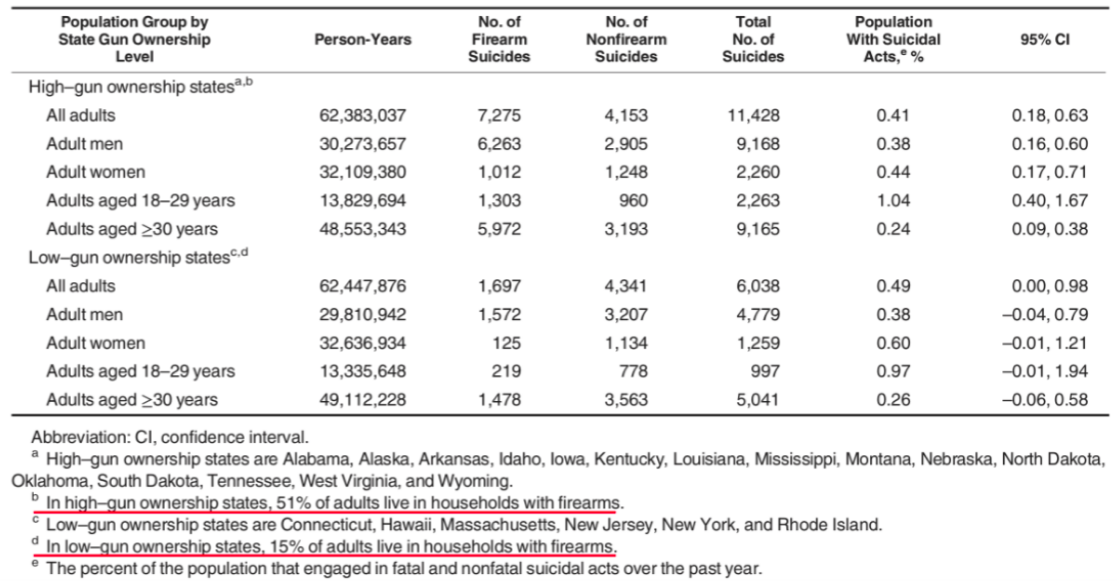
Suicide rates do not vary much per state, but rates do have to do with the availability of firearms in the home. Between 2008 and 2009, there were over 11,000 suicides in states with high gun ownership rates vs about 6,000 suicides in states with low gun ownership. The rate of suicide attempts overall did not vary from high to low gun ownership states.
Is Risk Independent of Underlying Suicidal Behavior? (source: Risk Independence of Suicide)
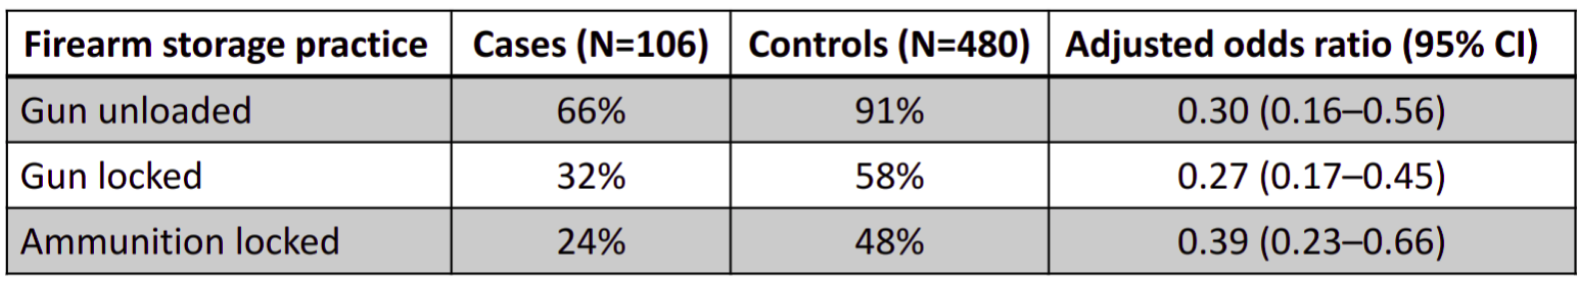
There is also a strong relationship between safer storage of guns in the home and lower rates of suicide for youth. Note how the rates of suicides in cases with guns stored unlocked (unsafely) is more than twice that of rates of suicides with guns stored safely (locked).
Firearm storage practices and suicide risk for 5 to 19-year-olds (source: Gun Storage Practices)
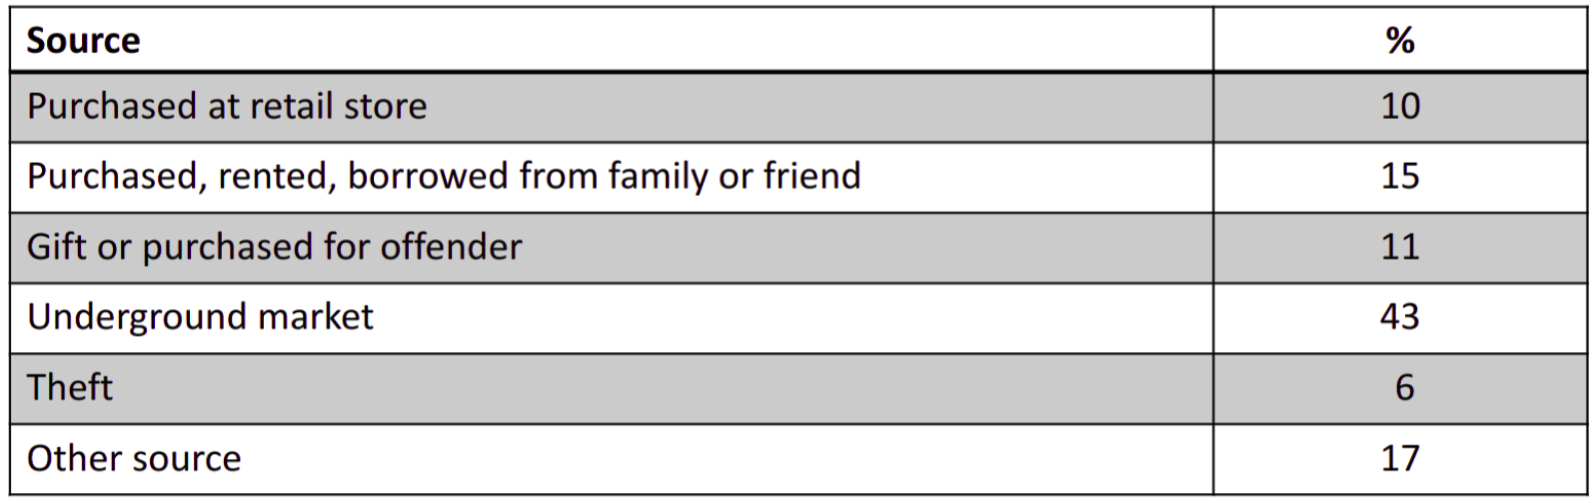
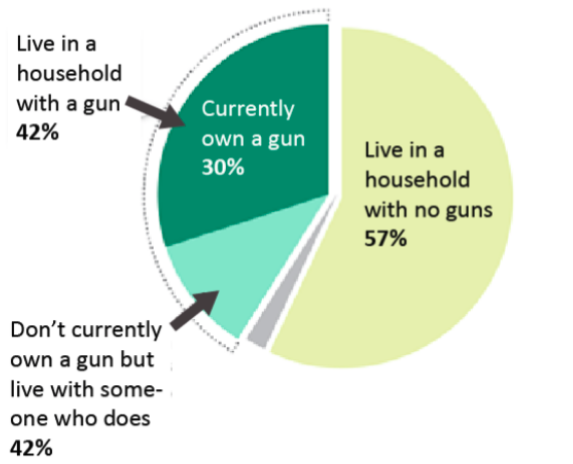
Let’s return to the topic of what we know about these guns that are in people’s homes:
- Around 265 million firearms are in the hands of civilians (source: Stock and Flow)
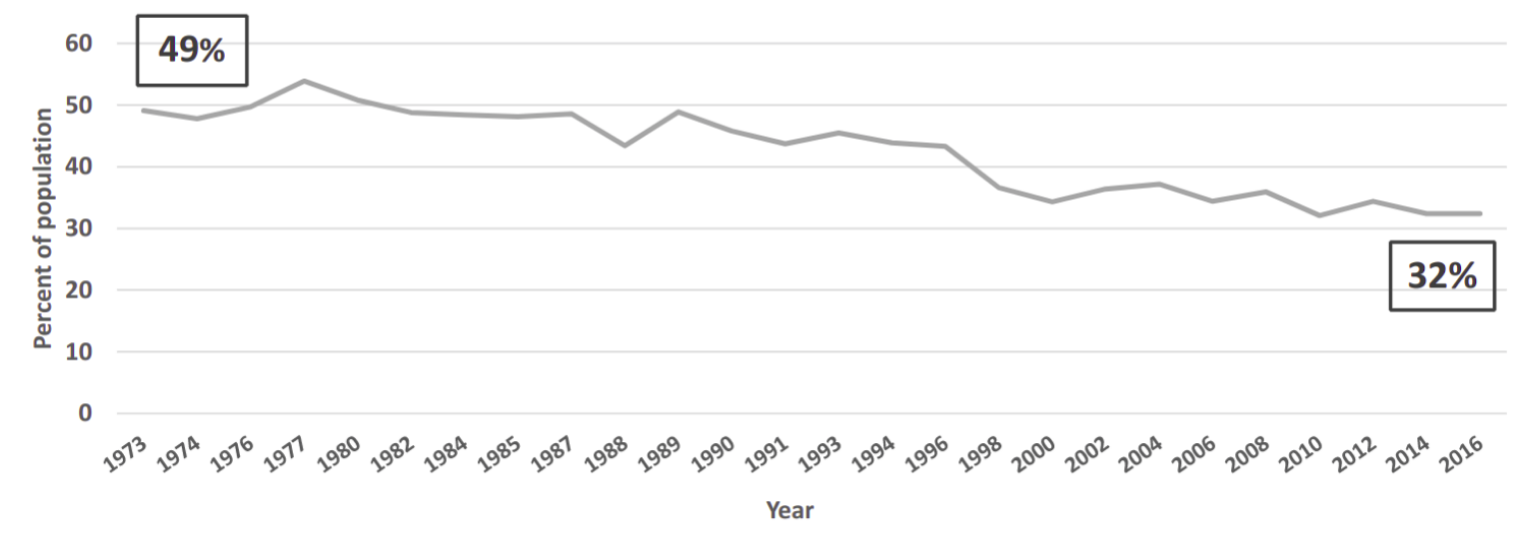
- 1/3 of US households own guns (estimate) (source: Stock and Flow)
- 5 million children live in homes with guns (estimate) (source: Firearm Storage with Children)
- Firearms are the most lethal method of commonly completed suicides (source: Case Fatality Rates)
- The majority of the guns used in these suicides come from the victim’s homes (source: Self-Inflicted Injuries)
- More than 90% of these guns have been in the home for more than two weeks, often years (source: Suicide in the Home)
- Gun owners and members of gun-owning homes are neither more depressed nor any more suicidal than members of non-gun-owning homes (source: Recent Psychopathology)
- No likely factor yet unstudied can account for the strong relationship between firearm availability and suicide (source: Are We Missing Something?)
There are success stories for suicide prevention based on empirical data. Here is one from the Israeli military. In the early 2000s, the Israeli military noticed that many service members were committing suicide, mostly during weekends with their service weapons. In 2006, the Israeli changed their firearm policy to prevent service members from taking their guns home on the weekend.

The result? (source: Decrease in Suicide)
- Suicide rates dropped by 40% over the weekend
- Suicide rates during the week remained unchanged
Are we using this data that we know?
As seen above, strong evidence exists that firearms do play a direct role in increasing suicide risk. Are we actually using this information?
A survey of emergency department employees, doctors, and nurses who worked with suicidal patients were asked if they thought restricting access to firearms would affect the suicide rate. They were asked the question:
“Had a firearm not been accessible to them, how many do you think would have found another way to die by suicide?”
The results were that a large fraction thought that most or all of the firearm suicide attempters would have found a similarly lethal way to die by suicide if their firearms had not been available (which we know is not true by the data presented above):
- 67% of nurses
- 43% of attending physicians
- 44% of resident physicians
Would suicide victims have died by another means if firearms were not available? (source: Lethal Means Restriction)

Those healthcare providers were then asked if they asked suicidal patients if they had firearms in their home.
- only two-thirds asked when a patient said they were suicidal and had a plan to use a gun
- less than 20% asked when a patient said they were suicidal but did not have a plan with a gun
Do you ask if firearms are at home? (source: Lethal Means Restriction)

In fact, when surveyed, most Americans do not think that restricting access to guns will have an effect on suicide rates, and they also show broader disbelief about restricting access to lethal means of suicide:
Does a gun in the home increase the risk of suicide? (source: Suicide Relationship Belief)

Generally speaking, members of the public do not believe the reality of the data about suicide prevention which shows that having a gun at home substantially increases the risk of suicide, both for the owner themselves and other household members.
Conclusions
Background on Suicide
- 60% of people in the US who are involved in firearm violence die due to suicide (almost 24,000 people)
- Suicide rates are not correlated with general well-being
- Suicide rates are significantly higher in states with higher gun ownership
- Most people attempting to harm themselves use non-fatal methods (> 80% of the time)
- But people using firearms in a suicide attempt will succeed more than 90% of the time
- Only 10% of suicide survivors go on to attempt it again later
- So saving someone’s life today from suicide means very likely saving their life in the long run
Data-driven Studies
- Many studies confirm that the availability of firearms cause an increase in suicide rates (not only correlation)
- Especially affects young adults and children when firearms are in the home
- Rate of suicide attempts does not vary from high to low gun ownership states
- Gun owners and members of gun-owning homes are neither more depressed nor any more suicidal than members of non-gun-owning homes
- Firearms in the home are a major contributor to the 47,000 suicide deaths that occur in the US every year
Are we using this data that we know?
- Members of the public do not believe the reality of the data about suicide prevention which shows that having a gun at home substantially increases the risk of suicide, both for the owner themselves and other household members
- This includes medical professionals such as emergency department personnel who see suicidal patients on a day to day basis
Next up: Laws, the Second Amendment, Litigation, and Obstacles to Research and Policy
References
- CDC Wonder – a public resource of health-related datasets for CDC staff, public health departments, researchers, and the general public. The year 2017 is the most recent year for which comprehensive, compiled data exists for firearm violence
- CDC WISQARS – a public database that provides fatal and nonfatal injury, violent death, and cost of injury data.
- Gallup Well-Being – results from the 2019 Gallup poll on well-being in all 50 US states
- Firearms in the Northeast – a research study from 2004 on whether firearm availability increases the overall number of suicides rather than the proportion of suicides from guns
- HCUP NIS – Healthcare Cost and Utilization Project National Inpatient Sample is the largest publicly available all-payer inpatient health care database in the United States, yielding national estimates of hospital inpatient stays. Data from 2005 was used.
- Accessibility of Firearms – a 2014 study to understand estimates of the association between firearm availability and suicide or homicide
- Risk Independence of Suicide – a 2013 study looking at the risk independence of suicidal behavior
- Gun Storage Practices – a 2005 study measuring the association of specific household firearm storage practices and the risk of unintentional and self-inflicted firearm injuries
- Stock and Flow – results from the 2015 National Firearms Survey
- Firearm Storage with Children – results from a nationally representative probability-based online survey sample of US adults conducted in 2015
- Case Fatality Rates – a 2004 study examining how method-specific case fatality rates for suicide differ by age and sex
- Self-Inflicted Injuries – a 1999 study to determine ownership and usual storage location of firearms used in unintentional and self-inflicted intentional firearm deaths and injuries
- Suicide in the Home – a 1992 study to assess the strength of the association between the availability of firearms and suicide
- Recent Psychopathology – a 2009 study to assess the relationship between firearm ownership and possible psychiatric confounders of the firearm–suicide relationship
- Are We Missing Something? – a 2016 study to determine the plausibility of some unaccounted variable in determining the causal relationship between firearm availability and suicide
- Decrease in Suicide – a study of the effects of a policy change in the Israeli Defense Forces reducing adolescents’ access to firearms on rates of suicide
- Lethal Means Restriction – a 2013 study examining the beliefs and behaviors of emergency department providers related to preventing suicide by reducing suicidal patients’ access to lethal methods
- Suicide Relationship Belief – a 2017 study using nationally representative sample to describe public opinion about whether household firearms increase the risk for suicide